Ridgefield Market Report May 2018
May 2018 was an interesting month. The number of closed sales was actually down with 27 sales as compared to 42 in May 2017. However, the median sales price was up almost 15%. Many more properties went under contract this year compared to the same time last year, and the days on market is lessened by almost 26%. Compared to last year, inventory is still low, as is the number of new properties entering the market.
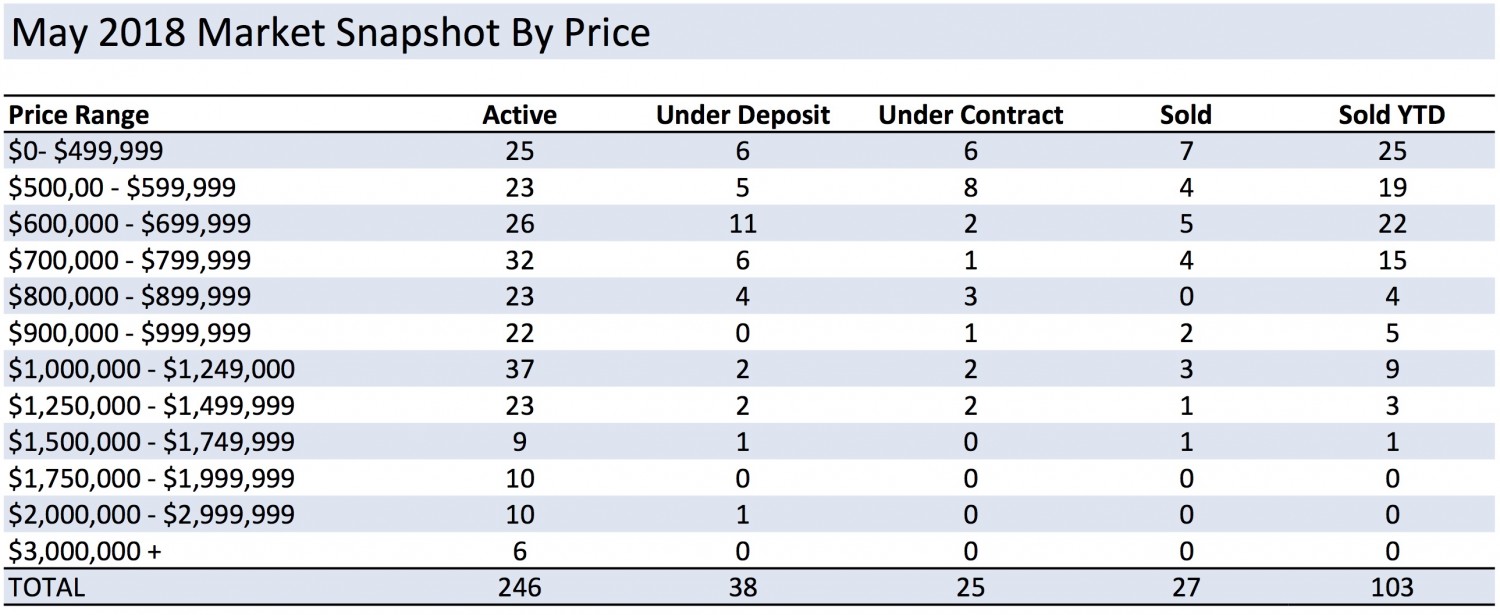
To see an overview of how May looked, you can click for a snapshot of the market.
MEDIAN SALES PRICE and CLOSED SALES
The number of closed sales was down compared to the same time last year with only 27 properties selling in April 2018 as compared to 42 in 2017. In YTD sales we are down 18% vs 2017 with 103 properties selling as compared to 126. This is not completely unexpected as homes closing in May would generally take deposits in March. March 2018 was cold, snowy and stormy without much market activity, so it stands to reason that the number of homes closing is less than last year. The Median Sales Price rose to $651,000 compared with $565,000 in May 2017, while the YTD median sales price also rose by 3.5% over last year.
PROPERTIES UNDER CONTRACT
Continuing the positive news, the number of properties that opened escrow drastically increased over the same time last year with 76 properties going under deposit in May as compared to 51 last year. Similarly, in the year-to-date deposits, there are 178 as compared to 147 by this time last year.
DAYS ON MARKET and INVENTORY
The months of inventory has decreased to only 4.9 months compared with 8.6 months last year. Also slightly alarming is the decrease in new properties coming on the market — May 2018 posted 8.0% fewer properties than last year and the lack of inventory can be a concern for buyers as they look for their next residence. The average days on market has decreased by 26% over May 2017 with homes spending an average 118 days instead of 160 on the market before selling. Year to date, the average days on market time is sitting at 147 days, as compared to 193 days last year at this time.
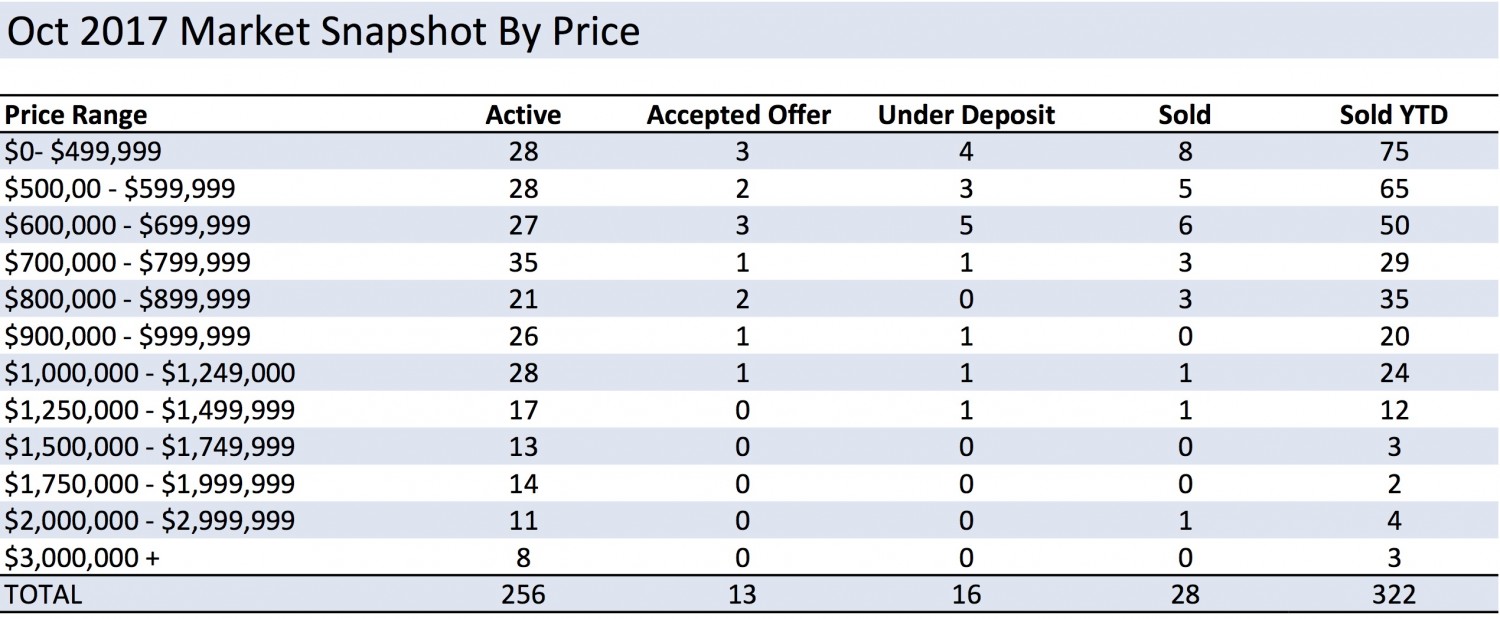
Click here to see a price breakdown of the Ridgefield Real Estate Market.
Now is a good time prepare or list your home for sale. Feel free to contact me to discuss your needs, or for my complimentary Comparative Market Analysis to find out what your home’s worth in today’s market.
We continue to lead the market with the most comprehensive, proven marketing initiatives allowing your home to be in front of the widest audience possible on a local, regional, national and global level. We recognize your home is your biggest asset and both buyers and sellers experience an unparalleled level of customer service when working with us. Contact us today!