Some Good News! Ridgefield’s Q1 2020 Market News

I hope everyone in your world is safe and healthy. Now, more than ever, we are reminded of the most important things in life. Health has become the new wealth.

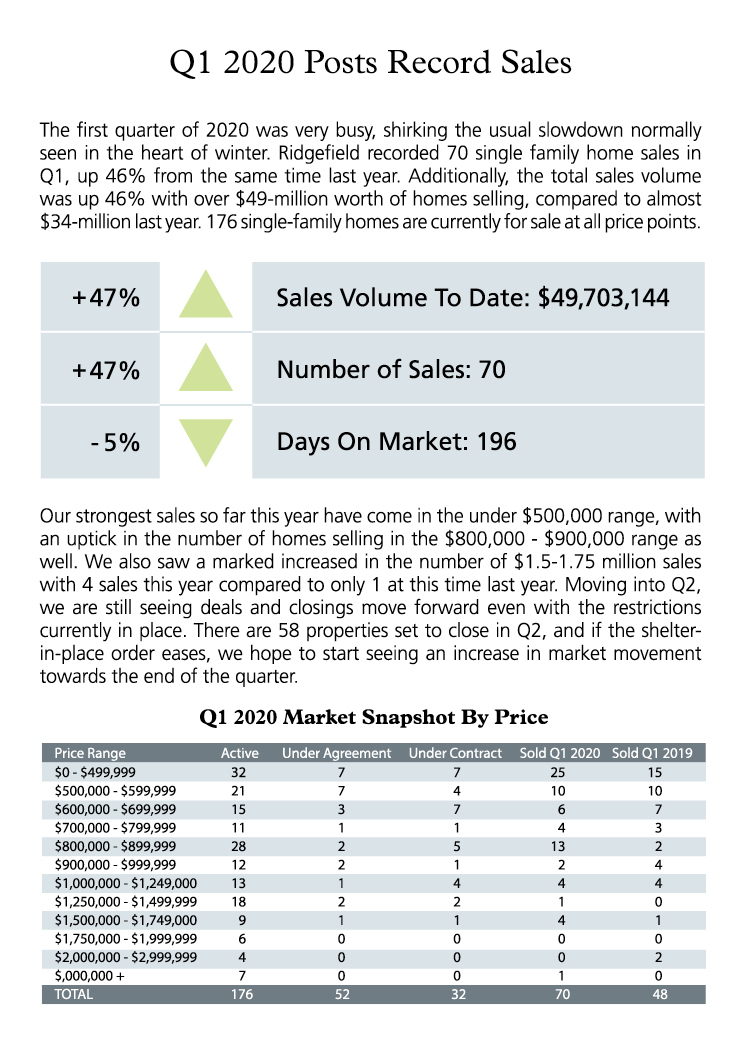
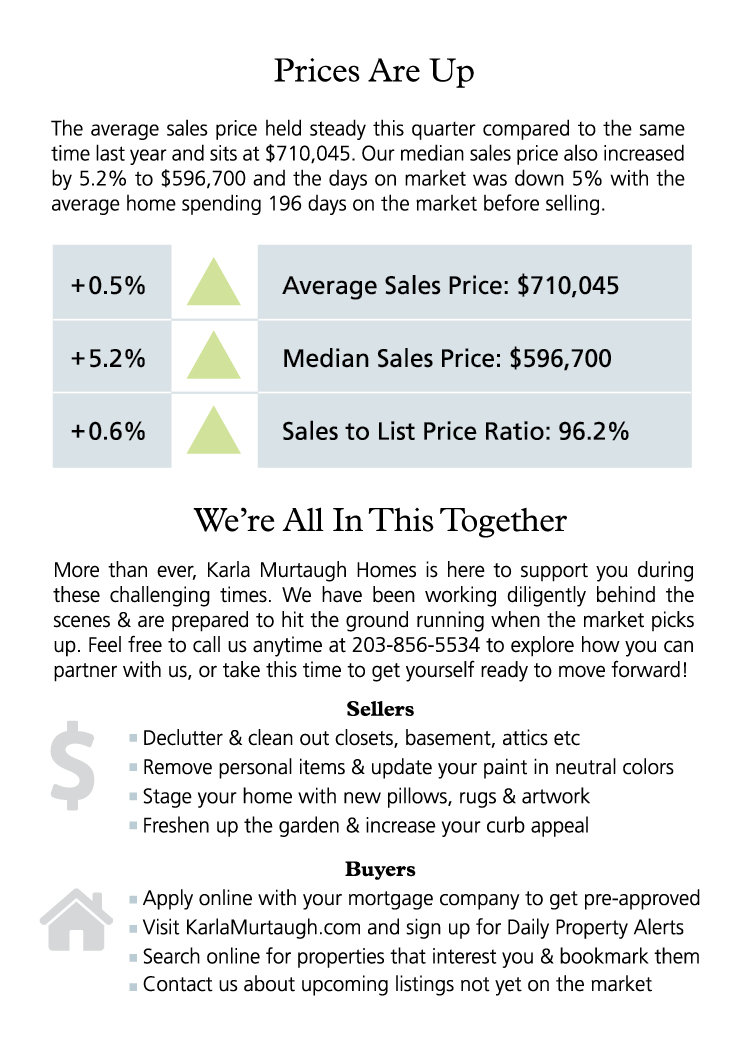
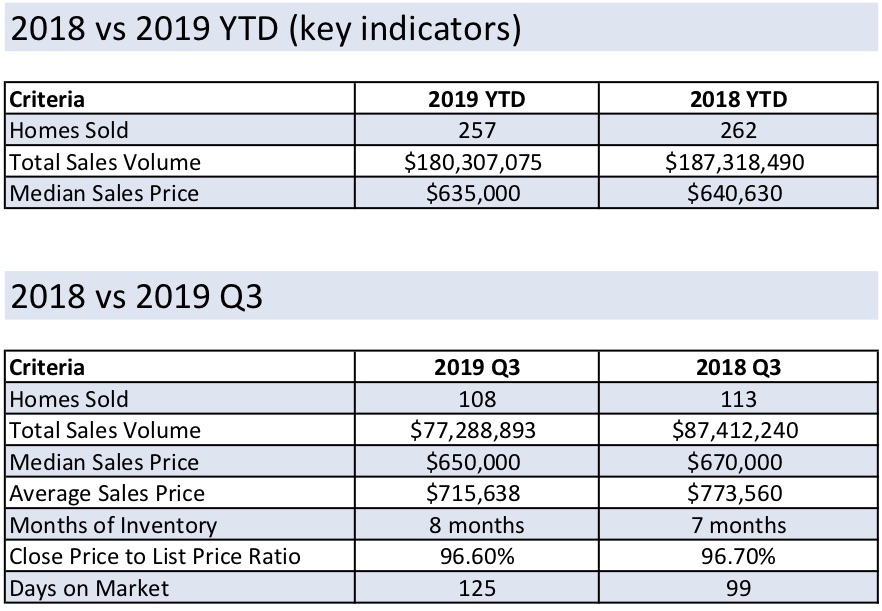
John Krasinski of The Office fame recently launched a YouTube Channel called SGN, which stands for Some Good News – and Ridgefield’s Q1 Market Report should definitely be featured! With 46% gains in both dollar volume and number of sales, 97% list to sales price ratio, and both the average and median price increasing over Q1 2019, this year’s real estate market was strong. All indications pointed to a healthy spring market as well, until our industry – and many others – were derailed in the short-term by COVID-19. Health and safety are definitely top-of-mind in our lives right now, but I feel it is important to keep you abreast of the Ridgefield real estate market during this downtime. We encourage you to read the full report.

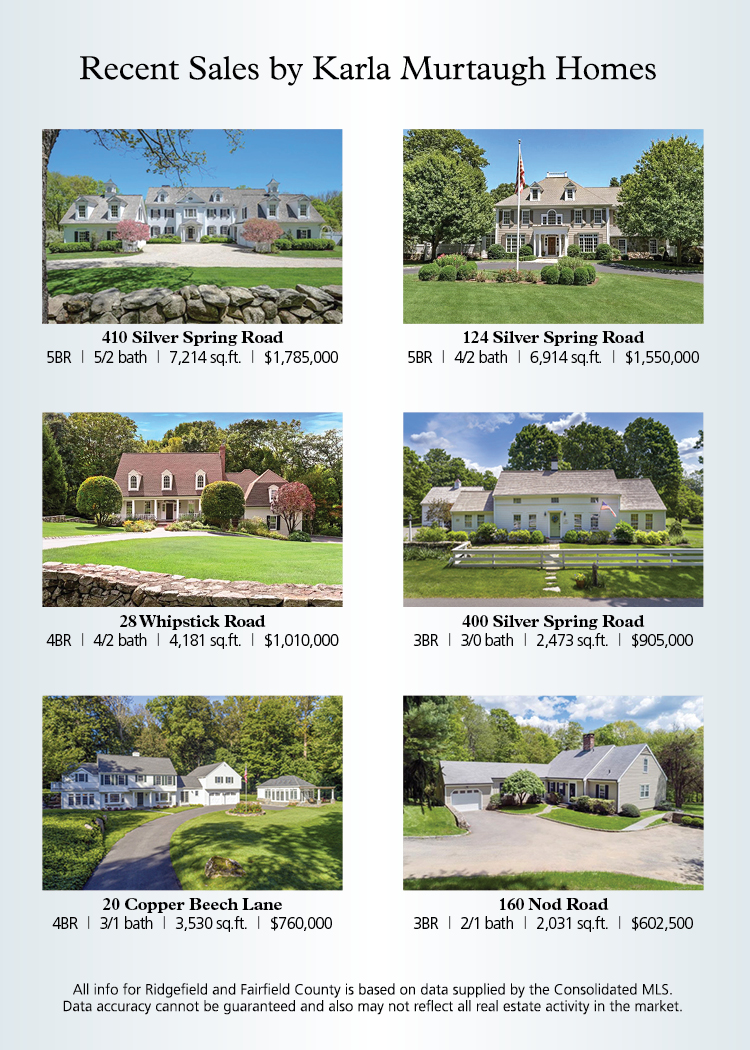
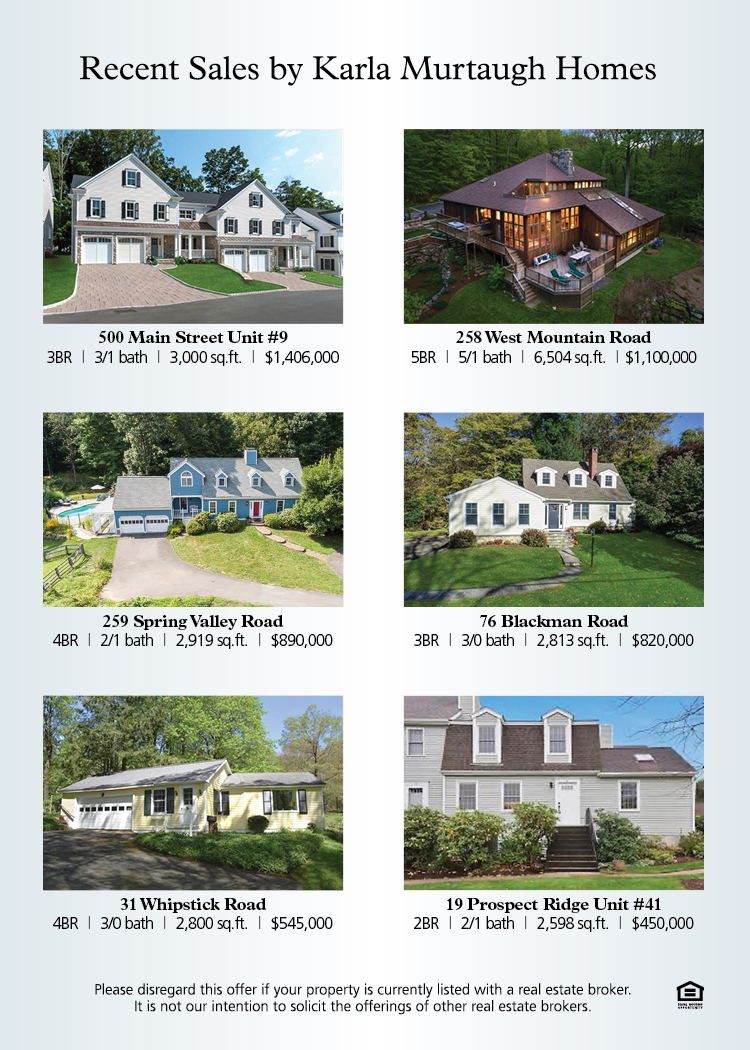
A question I have been asked many times recently is how is COVID-19 affecting the local real estate market? Up until a week or so ago, we were seeing increased traffic in Ridgefield and upper Westchester from NYC individuals looking for short-term, furnished rentals.  With those almost dried up, we are still seeing some activity as people search for homes outside of the city. Personally, our team closed 12 property sales in the first quarter. We have 6 additional properties currently under deposit to close between now and June, and have accepted offers on several properties seen before the shelter-in-place order was enacted. I continue to check in with top Realtors throughout Fairfield and Westchester counties in an effort to keep a pulse on the surrounding markets as well. The takeaway is that there are still people in the market in need of housing.

We are cautiously optimistic that the housing market will come back vigorously, but in the meantime stay home, stay healthy and stay positive.

Contact Us to explore how we can partner with you to meet and exceed your Real Estate goals.

DOWNLOAD THE FULL RIDGEFIELD Q1 2020 MARKET REPORT

Ridgefield’s 2019 Year In Review Market Report

Ridgefield Market Snapshot
2019 was an interesting year in Ridgefield Real Estate as we didn’t see the typical buying cycle emerge as in previous years. Summer – which is usually fairly busy – slowed slightly, while the fall and winter months have seen increased activity. Across the board sales of Single Family Homes in Ridgefield have been flat with the number of Closed Sales remaining steady at 327 versus 329 in 2018, and the Overall Sales Volume ending the year only $3-million less than 2018 at $233,379,725.

Median Sales Price also remained relatively constant at $628,250 – a difference of 2 percent compared to $641,260 last year. Average Sales Price is down half a percentage point over 2018 to $713,699. As in previous years, homes continue to sell at approximately 96.5% of ask, while the Days On Market rose slightly to 167 from 142. Moving into 2020, there are already double the number of homes under contract as compared to the same time in 2019.

The Luxury Market
18 luxury homes sold this past year, compared to 9 in 2018. Six of these sales were over $2-million. Proper pricing is critical to achieve maximum results in a reasonable time period. Sellers are advised to make sure their home is move-in ready and incorporate the additional features buyers are looking for such as mudrooms, Smart Home connectivity, generators, and updated kitchens and baths.

Condo Sales
Ridgefield continues to offer a wide selection of price points and availability to those looking for an alternative to a single-family home. This year, sales ranged from a one bedroom, one bath condo in Fox Hill for $150,000 to a $1.4 million, three bedroom, three bath luxury townhome in The Elms on Main Street. Overall, condo sales slowed with 55 units selling as compared to 70 last year. The Median Sales Price remained steady at $227,500 but the Average Sales Price decreased ending the year at $298,907

DOWNLOAD THE FULL REPORT

Contact Us to explore how we can partner with you to meet and exceed your Real Estate goals.

Ridgefield Real Estate Market Report Q3 2019

The third quarter of 2019 – reflecting activity during the summer months – was a little slower than anticipated. However, anecdotally it has been busy fall and we hope to finish the year strong posting sales that are similar, or even above those of last year.

In year-to-date figures, the number of properties that sold is reported at 257 compared to 262 last year. Overall, a total of $180,307,075 transacted by the end of Q3 2019 in contrast to $187,318,490 by this time in 2018. Total Sales Volume was down 2%, and Median Sales Price also showed a slight decrease from $640,630 in 2018, compared to $635,000 currently. However, in anticipation of Q4, there are already 28 homes with accepted offers and 17 under contract set to close. There are 247 properties actively for sale at this time, and with new homes launching on the market daily, we expect sales to continue to rise over the coming months.

In Q3 figures itself, the number of sales stayed similar at 108 in Q3 2019 compared to 113 in Q3 2018. The average days on market has taken a slight jump this year to 125, up from 99 last year. The average sales price decreased 7.5% this quarter compared to the same time last year and sits at $715,638. The median sales price dropped to $650,000 from $670,000. Homes are still selling at 96% of the listed value.

In mortgage news, 30-year fixed mortgage rates have remained at record lows, sitting at just under 4%, which bodes well for buyers entering the market. Our strongest sales so far this year have been in the under $800,000 range for single-family homes. Unfortunately, the luxury market is not as strong as in 2018 with only 5 properties sold over $1.5 million YTD as compared to 12 by this time last year.

As we move into the busy buying season prior to the Holidays setting in, I am optimistic by the amount of activity we have seen in the market in just the first few weeks of Q4. If you are interested in listing your home for sale before the end of the year – or picking up an end of year purchase – we would love to learn more about your needs. Contact us today.

To see a snapshot by price, click here.

To see how 2019 shapes up against 2018, click here.

Ridgefield’s 2019 Mid-Year Market Report

Ridgefield Market Snapshot
Ridgefield single family home sales are on par when compared to the same time last year. 150 homes sold during the first six months of the year, as compared to 147 in 2018. The median sales price stayed exactly the same at $625,000, while the total sales volume made modest gains ending the mid-year 4.5% higher than 2018 at $104,368,182. Even going back to 2017, we have seen the number of sales and the median sales price remain essentially flat, while the overall sales volume has fluctuated from a high in 2017 of $125,473,815 to a low in 2018 of $99,906,250.

While the median sales price remained the same year over year, we saw gains in the average sales price, which bodes well for the market as it indicates a general increase in what buyers are willing to pay. Year-to-date the average sales price was $695,788 – a 3.8% increase over the 2018 price of $670,512. This may sound modest, but considering 2017 had a high of $704,797, it indicates we are trending in the right direction. The months of inventory was slightly lower fluctuating between 8 and 15 months, while the list to closed price ratio was up over previous years at 96.7%.

The Luxury Market
Luxury market sales in Ridgefield – defined as homes selling for $1.5 million and above – have seen a huge uptick since this time last year, and in fact, are the strongest we’ve seen since 2016. There have been seven sales to date, compared to only one in 2018, two in 2017, and nine in 2016, while other Fairfield County towns, generally known for their luxury market, have flattened and reported less than stellar results so far this year. Traditionally, demand for these properties is strongest towards the end of the year so we hope to see this segment of the market continue to do well. There are currently an additional three homes under deposit set to close in the next few months and we’ve noticed that in the higher price points it is the motivated seller who is seeing the best results in the least amount of time.

Fairfield County Snapshot
The results are truly mixed for Fairfield County as a whole in the first half of 2019. Overall, median sales price was down throughout the county, as was total sales volume, but the number of unit sales increased in many towns. Traditionally strong commuter towns such as Darien and Greenwich had opposite results with Darien showing an increase in unit sales but the greatest decrease in median sales price in the county, and Greenwich showing an in increase in price but a decrease in the number of sales. Westchester County has also seen a decrease overall in the number of unit sales with median and average sales values down across the board. Looking ahead, we hope to see a more balanced market with supply and demand bringing prices back into alignment.

Looking Ahead
The spring market never seemed to materialize but we are seeing an increase in activity in the early summer months. Buyers continue to be in the driver’s seat in 2019 and sellers would be wise to make sure that their home is show ready before listing it for sale. Now, more than ever, it is important that these properties check off as many of the buyers’ boxes as possible. We continue to see in-town properties and those sporting the latest design trends garner top dollar. Inventory for small to medium-sized homes that are in turn key condition continues to be a challenge as baby boomers looking to downsize, and millennials looking to buy their first home, often overlap in what they desire. We are cautiously optimistic that Ridgefield Real Estate will remain steady. We are seeing 63% of sales coming from the purchase of homes under $700,000 indicating middle-class earners continue to find Ridgefield a desirable place to live with its access to great schools, major urban centers and exposure to a vibrant arts and leisure community.

DOWNLOAD THE FULL REPORT

Ridgefield Real Estate Market Report Q1 2019

The first quarter of 2019 shows promise for a strong spring market with 173 single-family homes currently on the market for sale at all price points. Already this year there are 39 single-family homes that have gone under agreement and a further 34 are in contract. With new properties launching on the market daily, we expect these numbers to rise over the coming months.

In mortgage news, 30-year fixed mortgage rates have again dropped to record lows, sitting at just over 4%, which bodes well for buyers entering the market. Our strongest sales so far this year have been in the under $500,000 range for single-family homes, and encouragingly our high-end luxury market (over $1.5 million) has also had 3 sales this year.

Overall, a total of $33,915,150 transacted during Q1 2019 in contrast to $32,298,800 by this time in 2018. The number of sales stayed the same at 48, while the average days on market has taken a slight jump this year to 208, up from 146 last year. A lack of new inventory could be to blame with some listings languishing on the market for various reasons.

The average sales price rose 5% this quarter compared to the same time last year and sits at $706,566. Interestingly, the median sales price dropped to $567,000 from $619,750, but the increased activity we have seen in the under $600,000 range in this early part of the year may account for the drop. We would expect to see this number rise as the year progresses. Homes are still selling at 96% of the listed value.

As we move into the busy spring and summer markets, we would love to learn more about your home and how we can help you list it for sale. And with more homes coming on the market every day, as well as lower mortgage rates, we would love to help you find your dream home! Contact us today.

To see a snapshot by price, click here.

Ridgefield’s 2018 Year In Review

Ridgefield Market Snapshot
The Ridgefield Real Estate market for single-family homes faced an interesting year in 2018 with a tumultuous mid-term election and the challenge of attracting businesses to the state. Combined with the new tax structure – the effects of which have not yet come to pass – and a bear market, Ridgefield sales rallied remarkably well showing a drop in volume, but no appreciable drop in value. Overall, the number of homes sold was down 11 percent with 329 homes selling in 2018 as compared to 370 in 2017. The total sales volume also decreased by 13 percent resulting in a total of $236,085,651 transacting as compared to $273,224,044 in 2017. The median sales price decreased only slightly from $642,500 to $641,260 (a difference of 0.2 percent) and the average home price fell by only 2.8 percent from $738,443 in 2017 to $717,586. Homes also continued the trend of selling at 96.5 percent of their listed price as in previous years.

In Condo News
As in 2017, there was a total of 70 condominium sales in Ridgefield in 2018 ranging in price from $129,000 for a one-bedroom apartment in Fox Hill, to $865,000 for a 3,200 square foot condominium on Sunset Lane. The average sales price was $330,174, while the median sales price was $235,000. This is down slightly from last year when the average price was $384,920 and the median price was $250,000. Of note, 3 luxury condos on Main Street are also due to close in the $1.3 million range in the early part of 2019.

The Luxury Market
The luxury market in Ridgefield-defined as homes selling for $1.5 million and above-continued to show decent market activity with 9 luxury homes selling in 2018, as compared to 13 homes in 2017. Of note, we represent 4 additional properties priced over $1.5 million currently in contract to close in the first part of 2019. Overall, we have noticed buyers are taking longer to commit to luxury purchases and are instead searching for just the right home-one that includes all the features and amenities they are looking for. As a Christie’s International Real Estate Luxury Specialist, in 2018 I was proud to represent 10 out of the 18 buyers and sellers who purchased luxury homes priced between $1.525 and $2.55 million.

Fairfield County News
Overall, Fairfield County experienced slight decreases in both the number of properties sold and median sales prices in 2018. Redding, Norwalk, Wilton and Fairfield showed an increase in values over last year, which is welcome news for homeowners in Wilton and Redding where home values had plummeted almost 10 percent back in 2017. Weston was able to rally back after being down 22% in mid-year unit sales. New Canaan continues to post double­ digit decreases in sales as a result of an increase in supply compared to demand especially in the upper price points.

Looking Ahead
In 2019, the buyer’s market will continue with the biggest discussions centered on mortgage rates and available inventory. In terms of inventory, we hope to see sellers continue to list their homes, attracting solidly qualified buyers who still see this market as a good time to buy. In 2018, Ridgefield lacked entry-level inventory in the under $600,000 range as well as the $800,000 – $1.2 million range. We are hoping to see that turn around in 2019. The two largest groups of buyers and sellers will continue to influence the market with Millennials moving to the better value of the suburbs and baby-boomers downsizing, thereby freeing up more inventory. Ridgefield continues to be a desirable place to live with its top-ranked schools, great cultural attractions, world-class dining and amazing sense of community.

DOWNLOAD THE FULL REPORT

Ridgefield Market Report November 2018

November 2018 showed prices and volume of sales holding steady as compared to 2017.  The month ended with the number of closed sales at 23 properties which is the same number of properties that sold in November of last year. However, more properties opened Escrow in November 2018 than 2017, reflecting anecdotally what we saw as a busy fall market. The median sales price is slightly up over last year for the month and is on par year-to-date.  Inventory is about 21% lower than at the same  time last year.

To see an overview of how November looked, you can click for a snapshot of the market.

MEDIAN SALES PRICE and CLOSED SALES
The number of closed sales was exactly the same as last year with 23 properties selling in November 2018 and 2017. In YTD, sales are down 12.7% vs 2017 with 303 properties selling as compared to 347 by the same time last year. The Median Sales Price increased to $652,000 compared with $645,000 in November 2017, while the YTD median sales price remained around the same with a 0.2% increase to $641,260 this year.

PROPERTIES UNDER CONTRACT
The number of properties that opened escrow was above the same time last year with 30 properties going under deposit in November as compared to 22 last year, representing a 36.5% increase. With regard to the year-to-date deposits, there are now 327 properties that have taken a deposit  as compared to 339 by this time last year.

DAYS ON MARKET and INVENTORY
The months of inventory remains low with only 9.3 months of inventory available compared to 13.6 last year. The number of new properties entering the market is still cause for concern with only 34 new properties listing this past month. Year to date the number of new properties available for sale is also down with only 606 listed for sale this year as compared to 633 last year. The average days on market increased slightly over November 2017 with homes spending an average 180 days instead of 171 on the market before selling. Year to date, the average days on market time is sitting at 133 days, as compared to 169 days last year.

Click here to see a price breakdown of the Ridgefield Real Estate Market.

Feel free to contact me to discuss your needs, or for my complimentary Comparative Market Analysis to find out what your home’s worth in today’s market.

We continue to lead the market with the most comprehensive, proven marketing initiatives allowing your home to be in front of the widest audience possible on a local, regional, national and global level. We recognize your home is your biggest asset and both buyers and sellers experience an unparalleled level of customer service when working with us. Contact us today!

November Market Snapshot

Breakdown By Price

Ridgefield Market Report September 2018

September 2018 was pretty much on par with 2017.  The number of closed sales was up slightly with 24 sales as compared to 20 in September 2017.  The median sales price was down 1.3% for the month but equal to 2017 year to date. An equal number of properties also went under deposit this year compared to last, but was still down on the year. Inventory is also still low, as is the number of new properties entering the market.

To see an overview of how September looked, you can click for a snapshot of the market.

MEDIAN SALES PRICE and CLOSED SALES
The number of closed sales was u[ slightly compared to the same time last year with 24 properties selling in September 2018 as compared to 20 in 2017. In YTD sales we are down 1.5% vs 2017 with 262 properties selling as compared to 296. The Median Sales Price decreased to $592,500 compared with $600,000 in May 2017, while the YTD median sales price was equal to the same time last year.

PROPERTIES UNDER CONTRACT
The number of properties that opened escrow was on par with the same time last year with 26 properties going under deposit in September as compared to 27 last year. In regard to the year-to-date deposits, there are 267 as compared to 289 by this time last year.

DAYS ON MARKET and INVENTORY
The months of inventory i the same as last year at 12.2 months this year as compared to 12.3 last year. The number of new properties entering the market is still cause for concern with a 15% decrease compared to September 2017. The average days on market increased by 39% over September 2017 with homes spending an average 161 days instead of 116 on the market before selling. Year to date, the average days on market time is sitting at 130 days, as compared to 171 days last year.

Click here to see a price breakdown of the Ridgefield Real Estate Market.

Feel free to contact me to discuss your needs, or for my complimentary Comparative Market Analysis to find out what your home’s worth in today’s market.

We continue to lead the market with the most comprehensive, proven marketing initiatives allowing your home to be in front of the widest audience possible on a local, regional, national and global level. We recognize your home is your biggest asset and both buyers and sellers experience an unparalleled level of customer service when working with us. Contact us today!

September Market Snapshot

KMM Sept 2018

Ridgefield Market Report August 2018

August 2018 was a great month in Ridgefield real estate.  The number of closed sales was slightly down with 45 sales as compared to 50 in August 2017.  However, the median sales price was up 6.2%. Many more properties went under contract this year compared to the same time last year, and the days on market is lessened by almost 20%. Compared to last year, inventory is still low, as is the number of new properties entering the market.

To see an overview of how August looked, you can click for a snapshot of the market.

MEDIAN SALES PRICE and CLOSED SALES
The number of closed sales was down compared to the same time last year with only 45 properties selling in August 2018 as compared to 50 in 2017. In YTD sales we are down 13.8% vs 2017 with 238 properties selling as compared to 276.  The Median Sales Price rose to $648,000 compared with $642,500 in August 2017, while the YTD median sales price also rose by 0.9% over last year.

PROPERTIES UNDER CONTRACT
Continuing the positive news, the number of properties that opened escrow drastically increased over the same time last year with 37 properties going under deposit in August as compared to 29 last year. In the year-to-date deposits however, 2018 still lags behind with 251 properties under deposit as opposed to 262 by this time last year.

DAYS ON MARKET and INVENTORY
The months of inventory remain low at 9.4 months compared with 12.2 months last year. Also slightly alarming is the decrease in new properties coming on the market — year to date August 2018 posted 7.5% fewer properties than last year and the lack of inventory can be a concern for buyers as they look for their next residence. The average days on market has decreased by 20% over August 2017 with homes spending an average 129 days instead of 161 on the market before selling. Year to date, the average days on market time is sitting at 128 days, as compared to 175 days last year at this time.

We continue to lead the market with the most comprehensive, proven marketing initiatives allowing your home to be in front of the widest audience possible on a local, regional, national and global level. We recognize your home is your biggest asset and both buyers and sellers experience an unparalleled level of customer service when working with us. Contact us today!