
Ridgefield Market Report November 2018
November 2018 showed prices and volume of sales holding steady as compared to 2017. The month ended with the number of closed sales at 23 properties which is the same number of properties that sold in November of last year. However, more properties opened Escrow in November 2018 than 2017, reflecting anecdotally what we saw as a busy fall market. The median sales price is slightly up over last year for the month and is on par year-to-date. Inventory is about 21% lower than at the same time last year.
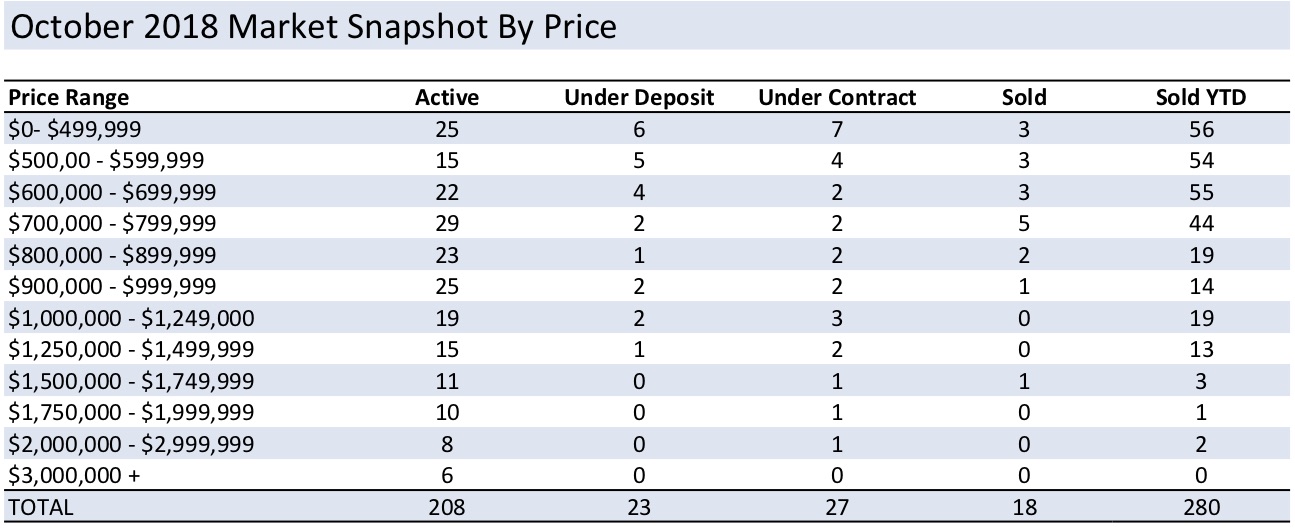
To see an overview of how November looked, you can click for a snapshot of the market.
MEDIAN SALES PRICE and CLOSED SALES
The number of closed sales was exactly the same as last year with 23 properties selling in November 2018 and 2017. In YTD, sales are down 12.7% vs 2017 with 303 properties selling as compared to 347 by the same time last year. The Median Sales Price increased to $652,000 compared with $645,000 in November 2017, while the YTD median sales price remained around the same with a 0.2% increase to $641,260 this year.
PROPERTIES UNDER CONTRACT
The number of properties that opened escrow was above the same time last year with 30 properties going under deposit in November as compared to 22 last year, representing a 36.5% increase. With regard to the year-to-date deposits, there are now 327 properties that have taken a deposit as compared to 339 by this time last year.
DAYS ON MARKET and INVENTORY
The months of inventory remains low with only 9.3 months of inventory available compared to 13.6 last year. The number of new properties entering the market is still cause for concern with only 34 new properties listing this past month. Year to date the number of new properties available for sale is also down with only 606 listed for sale this year as compared to 633 last year. The average days on market increased slightly over November 2017 with homes spending an average 180 days instead of 171 on the market before selling. Year to date, the average days on market time is sitting at 133 days, as compared to 169 days last year.
Click here to see a price breakdown of the Ridgefield Real Estate Market.
Feel free to contact me to discuss your needs, or for my complimentary Comparative Market Analysis to find out what your home’s worth in today’s market.
We continue to lead the market with the most comprehensive, proven marketing initiatives allowing your home to be in front of the widest audience possible on a local, regional, national and global level. We recognize your home is your biggest asset and both buyers and sellers experience an unparalleled level of customer service when working with us. Contact us today!


