Why Now Is A Good Time To Buy A Home
According to Keeping Current Matters, whether you are a first-time buyer or looking to move up to the home of your dreams, now is a great time to purchase a home. Here are three major reasons to buy today.
1. Affordability
Many people focus solely on price when talking about home affordability. Affordability is determined by three components:
- Price
- Wages
- Mortgage Interest Rate
Nationally, prices and wages are up, and interest rates have recently dropped dramatically. As a result, the National Association of Realtors’ (NAR) latest Affordability Index report revealed that homes are more affordable throughout the country today than they were a year ago.
2. Mortgage Rates
Mortgage rates have dropped almost a full point after heading toward 5% last fall and early winter. Currently, they are below 4%.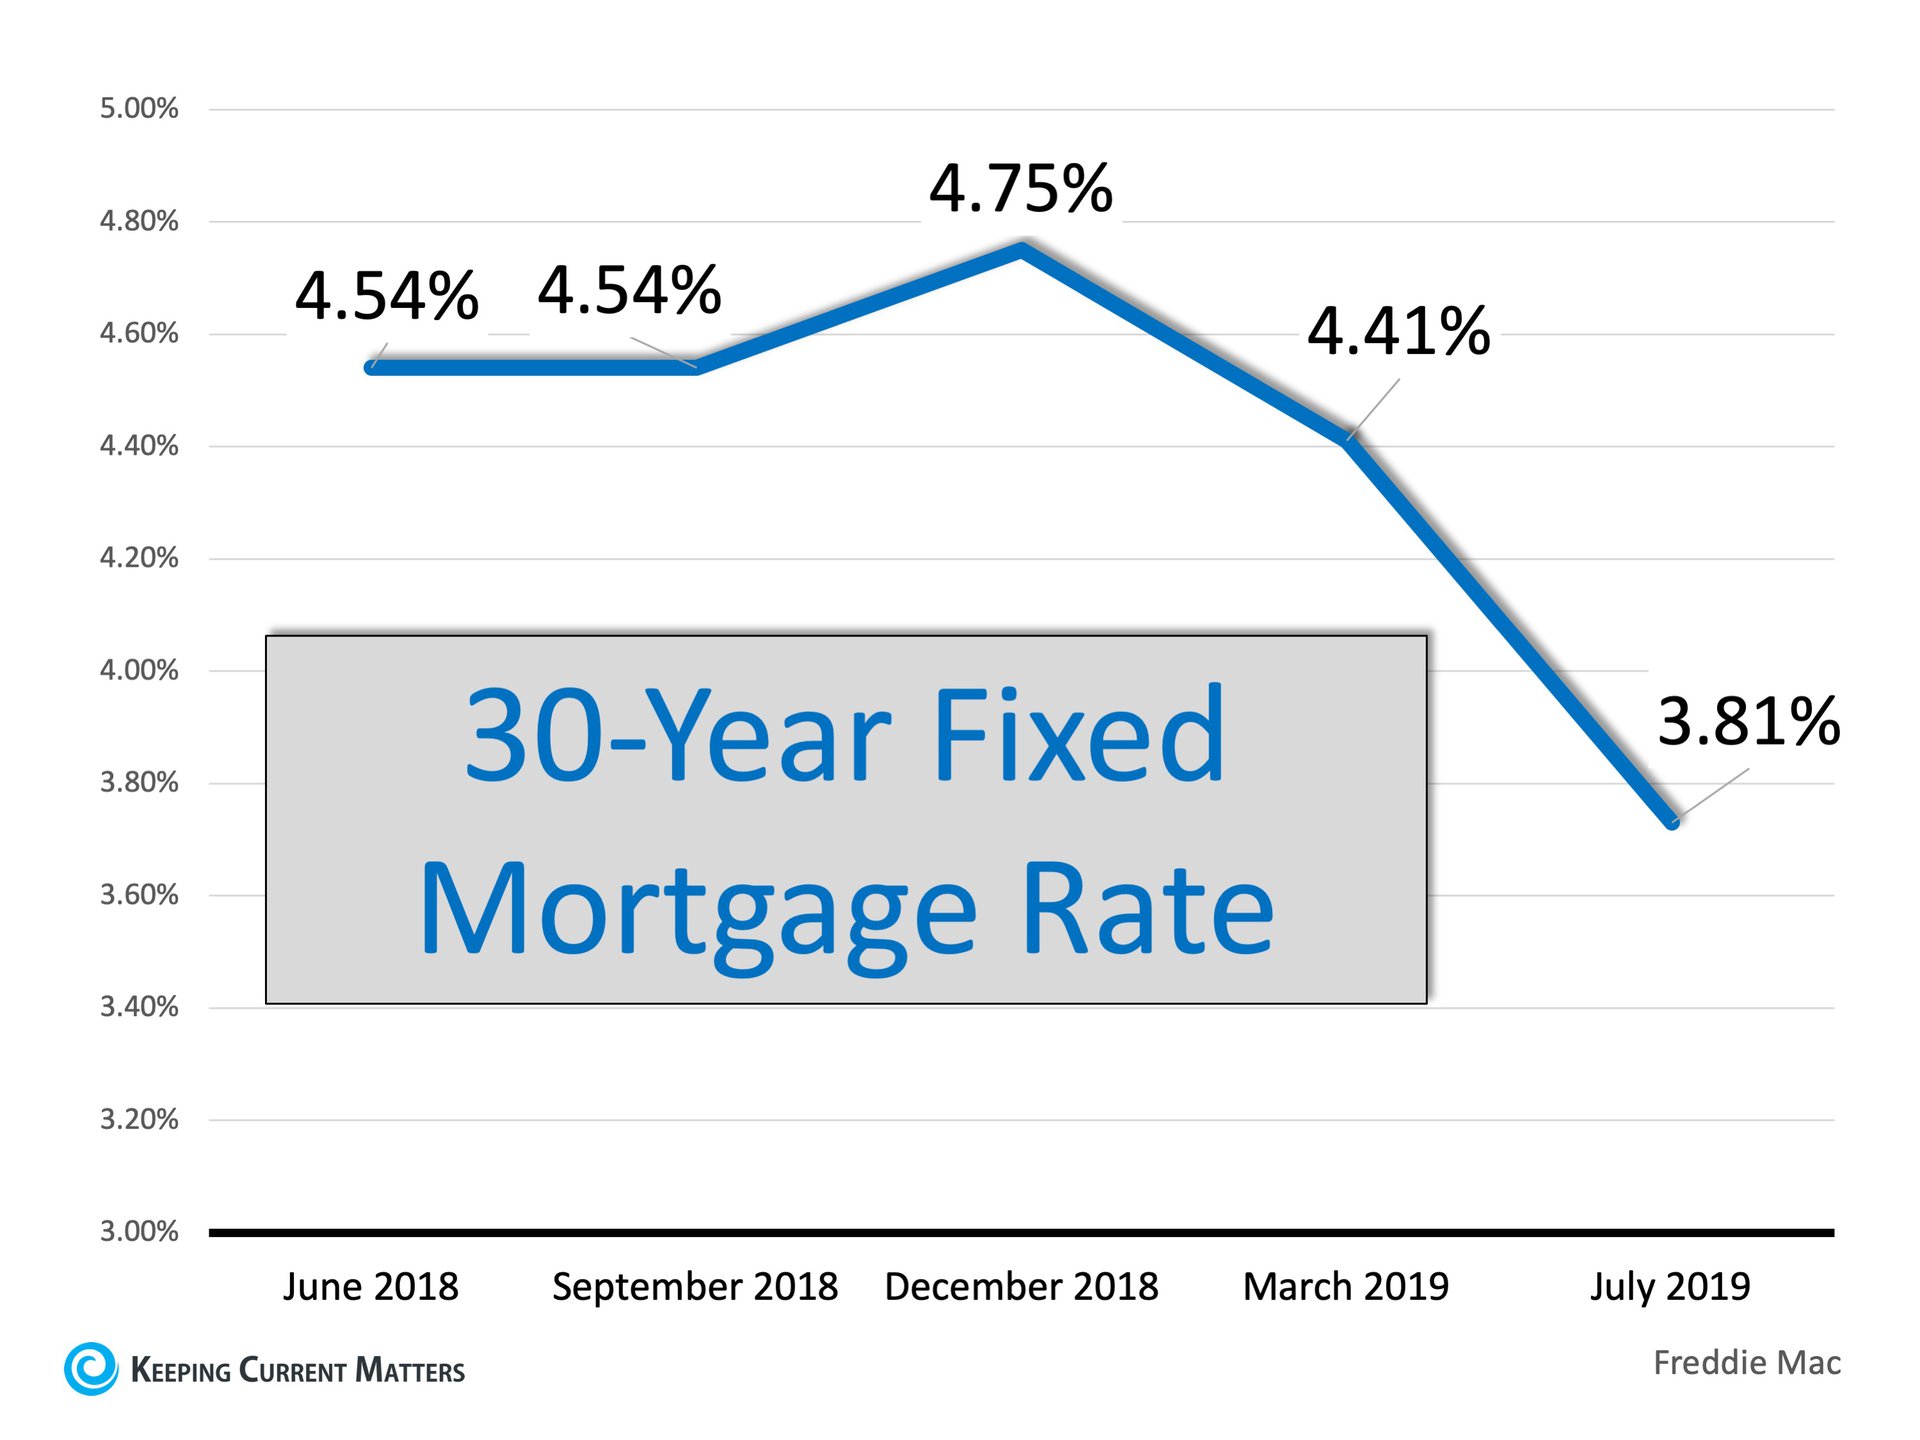 Additionally, Fannie Mae recently predicted the average rate for a 30-year fixed mortgage will be 3.7% in the second half of 2019. That compares to a 4.4% average rate in the first quarter and 4% in the second quarter.
3. Increased Family Wealth
Homeownership has always been recognized as a way to build long-term family wealth. A new report by ATTOM Data Solutions reveals:
“U.S. homeowners who sold in the second quarter of 2019 realized an average home price gain since purchase of $67,500, up from an average gain of $57,706 in Q1 2019 and up from an average gain of $60,100 in Q2 2018. The average home seller gain of $67,500 in Q2 2019 represented an average 33.9 percent return as a percentage of original purchase price.”
The longer you delay purchasing a home, the longer you are waiting to put the power of home equity to work for you. While we haven’t seen short-term gains in some price points in the Ridgefield market, in the long run, real estate is generally a safe bet to build equity and wealth.
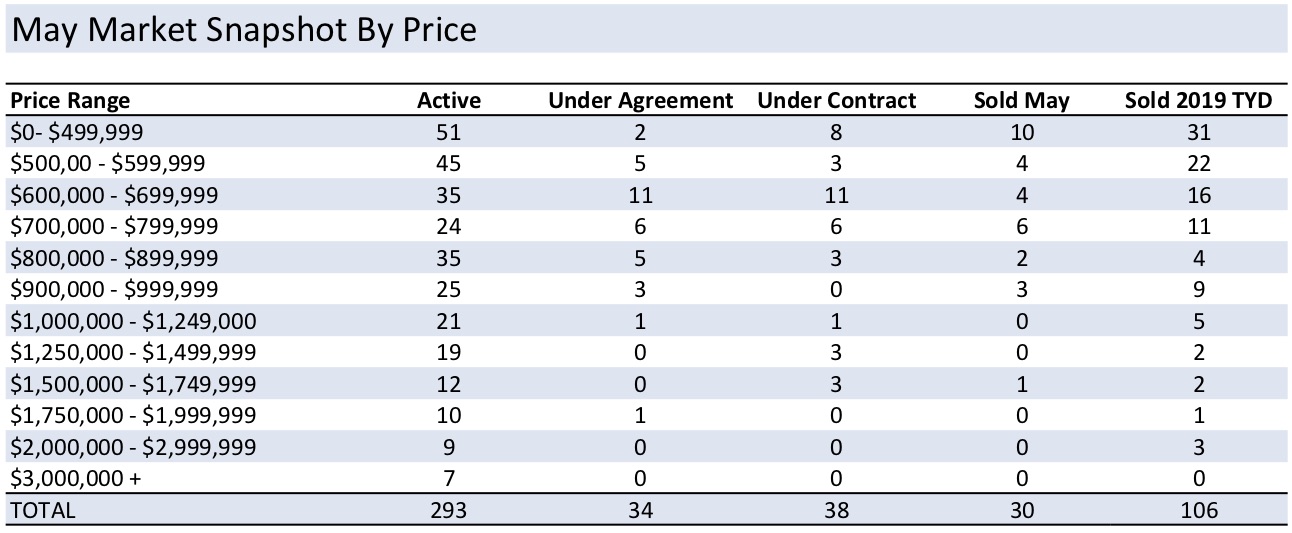
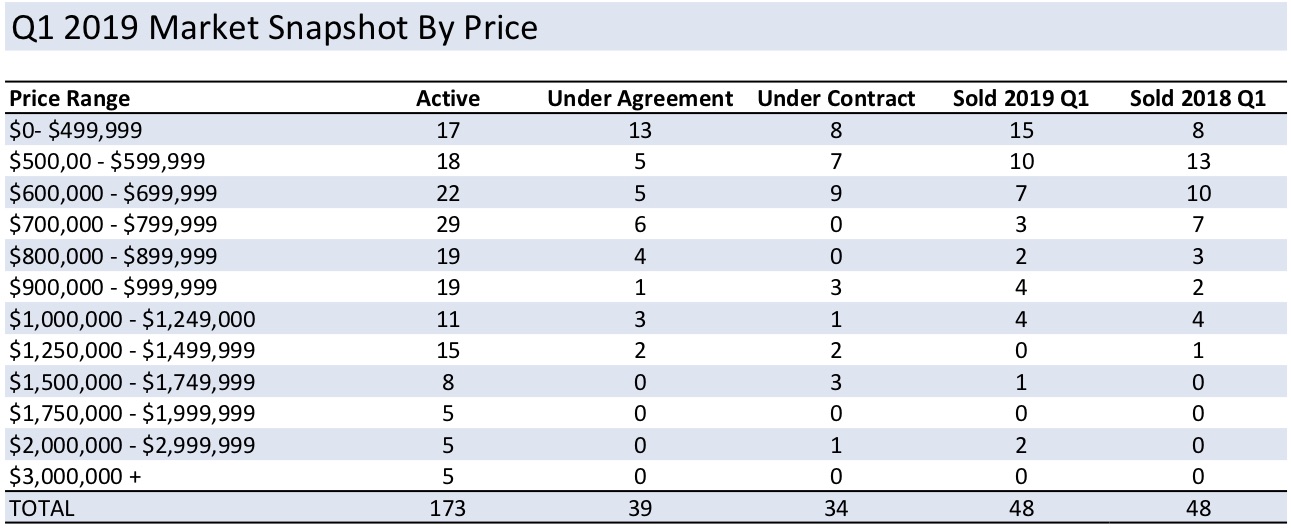
For more information about the Ridgefield Real Estate Market, check out our mid-year report available here.
*Originally posted on Keeping Current Matters