Tag Archive for: Buying
Ridgefield Market Report November 2018
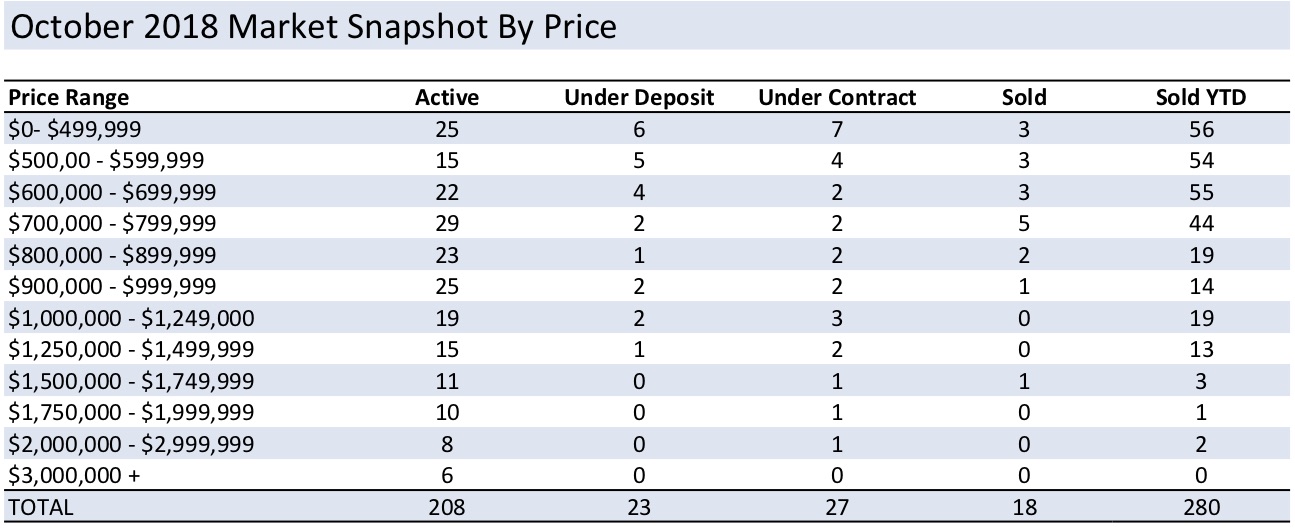
November 2018 showed prices and volume of sales holding steady as compared to 2017. The month ended with the number of closed sales at 23 properties which is the same number of properties that sold in November of last year. However, more properties opened Escrow in November 2018 than 2017, reflecting anecdotally what we saw as a busy fall market. The median sales price is slightly up over last year for the month and is on par year-to-date. Inventory is about 21% lower than at the same time last year.
To see an overview of how November looked, you can click for a snapshot of the market.
MEDIAN SALES PRICE and CLOSED SALES
The number of closed sales was exactly the same as last year with 23 properties selling in November 2018 and 2017. In YTD, sales are down 12.7% vs 2017 with 303 properties selling as compared to 347 by the same time last year. The Median Sales Price increased to $652,000 compared with $645,000 in November 2017, while the YTD median sales price remained around the same with a 0.2% increase to $641,260 this year.
PROPERTIES UNDER CONTRACT
The number of properties that opened escrow was above the same time last year with 30 properties going under deposit in November as compared to 22 last year, representing a 36.5% increase. With regard to the year-to-date deposits, there are now 327 properties that have taken a deposit as compared to 339 by this time last year.
DAYS ON MARKET and INVENTORY
The months of inventory remains low with only 9.3 months of inventory available compared to 13.6 last year. The number of new properties entering the market is still cause for concern with only 34 new properties listing this past month. Year to date the number of new properties available for sale is also down with only 606 listed for sale this year as compared to 633 last year. The average days on market increased slightly over November 2017 with homes spending an average 180 days instead of 171 on the market before selling. Year to date, the average days on market time is sitting at 133 days, as compared to 169 days last year.
Click here to see a price breakdown of the Ridgefield Real Estate Market.
Feel free to contact me to discuss your needs, or for my complimentary Comparative Market Analysis to find out what your home’s worth in today’s market.
We continue to lead the market with the most comprehensive, proven marketing initiatives allowing your home to be in front of the widest audience possible on a local, regional, national and global level. We recognize your home is your biggest asset and both buyers and sellers experience an unparalleled level of customer service when working with us. Contact us today!
Karla Murtaugh of Neumann Real Estate is Ridgefield’s only Christie’s International Real Estate Luxury Specialist for five years running
Karla Murtaugh of Neumann Real Estate joined more than 250 agents at the invitation-only, Fall 2018 Christie’s International Real Estate Luxury Specialist Conference held at Christie’s flagship auction house at Rockefeller Plaza in New York. The annual conference is designed to further affiliated agents’ knowledge in the important luxury asset classes of art, jewelry and, of course, real estate, in order to better serve their valued clients.
Speakers included top producers in real estate sharing the secrets of their success, Christie’s specialists with insights into how to elevate client service through the auction house, and an economist providing a look at what 2019 might hold. At the conclusion of the conference, attendees were designated as a “Christie’s International Real Estate Luxury Specialist” by Christie’s Education. Christie’s International Real Estate is the real estate arm of Christie’s, the world’s leading art business and a global brand synonymous with luxury for over 250 years.
“This conference is invaluable as it gives both a high-level overview of the luxury industry, while providing concrete information and resources that benefit buyers and sellers at all price points,” said Karla Murtaugh. “Unparalleled market knowledge, exceptional marketing and top-notch customer service are my hallmarks; buyers and sellers expect you to have an understanding of not only the local real estate market, but of national and global influences as well, and Christie’s provides that.”
Dan Conn, CEO of Christie’s International Real Estate, said: “One of the hallmarks of the Christie’s brand is exemplary client care. This conference provides network agents the opportunity to better understand and leverage Christie’s full spectrum of expertise in art, luxury goods, and real estate. The agents who attend are proven experts in their local markets, motivated to pursue continuing education in the luxury market and well-deserving of being designated a Luxury Specialist.
About Christie’s International Real Estate
Christie’s International Real Estate has successfully marketed high-value real estate around the world for more than 30 years. Through its New York City brokerage and invitation-only Affiliate network spanning 49 countries, Christie’s International Real Estate offers incomparable services to a global clientele at the luxury end of the residential property market. The company has offices in London, New York City, Hong Kong, Moscow, Los Angeles, and Palm Beach, and its affiliated brokerages have recorded approximately US$500 billion of real estate transactions over the last five years. (Data as of June 30, 2018). For additional information, please visit www.christiesrealestate.com.
Ridgefield’s 2018 Mid Year Market Report
The Ridgefield Real Estate market continues to favor the buyer, but we have had a number of multiple bid situations on properties that are updated and priced correctly. Condition, along with location and proximity to Main Street, continue to be key drivers for sales across all price points. Buyers are becoming increasingly savvy about market conditions and trends due to the availability of data on public websites such as Zillow and Realtor.com. The threat of a mortgage rate increase does not seem to be affecting buyer decisions either as they bide their time and wait for the ‘right’ home.
The good news is that buyers are still willing to pay for properties they find desirable with properly priced homes selling at 96.5% of their listed price. As was the case last year, properties under $800,000 seem to hit the sweet spot in Ridgefield. The town continues to be a destination for families moving from areas within the metropolitan region, as well as relocating from other states due to our family-friendly environment, quality of life and access to major commerce centers. We also continue to see families move within Ridgefield, which is a testament to the ‘staying power’ of our town.
No Gain In Value
Overall, the Ridgefield real estate market continues to remain relatively flat across the board. A six-week weather delay created a sluggish spring market, resulting in lower unit sales and decreased overall volume sold. 147 homes were sold during the first six months of 2018, as opposed to 178 last year. The total sales volume registered a 21% decrease, ending the mid-year at $98,851,250. However, the median sales price remained on par with last year at $625,000 compared with $627,000 from January to June in 2017.
Where Are Buyer’s Buying?
As in previous years, during the first half of 2018 in-town properties are in demand with 42 percent of all sales occurring within a two-mile radius of Town Hall (considered Village center). The median sales price of these homes was $692,500, and the average sales price was $724,526 – both of which are above the town as a whole. Three of the four luxury condominiums valued at over $700,000 were also located in-town. These sales reflect the growing trend for more walkable properties close to restaurants, shopping and culture
Condo Report
There were 33 condominium sales in the first half of 2018 ranging in price from $135,000 for a one bedroom, one bath townhouse in Fox Hill to $865,000 for a three bedroom, two full and two half bath townhouse on Sunset Lane. The median sales price was $267,000, while the average sales price was $354,567. Compared to the first six months of 2017, the median sales price has risen by 14%, while the average sale price decreased by 12%. This discrepancy is due to a greater number of higher priced condominiums selling in the first half of 2017 compared to 2018.
The Luxury Market
Luxury market sales – defined as homes selling for $1.5 million and above – are comparable to the 2017 mid-year mark. So far we have seen one sale for $1,540,000 close, as compared to two during the same period last year. As of July 1st five luxury properties are either under deposit or in contract to close in the third quarter ranging in value from $1.745 million to $2.395 million. Historically, more luxury properties close in the third and fourth quarters. Anecdotally, interest in the upper price range remains strong with many homes experiencing a number of showings. Many luxury properties have also adjusted their pricing to attract the upper tier buyer looking for value and compelling offerings.
Activity Down In Fairfield County
After several years of growth, unit sales throughout Fairfield County slipped during the first half of 2018 with decreases noted across the board. Towns closer to Manhattan such as Greenwich, Darien and Norwalk saw modest increases in the median sales price, but still registered a decreased number of unit sales. While Fairfield County is still considered attractive for families due to the quality of life and great schools, the sense of urgency by buyers to make the move seems to have slowed. Looking ahead, market activity seems slightly higher than normal as we move into the summer months, which will hopefully equate to increased sales in the second half of the year.
Ridgefield Market Report May 2018
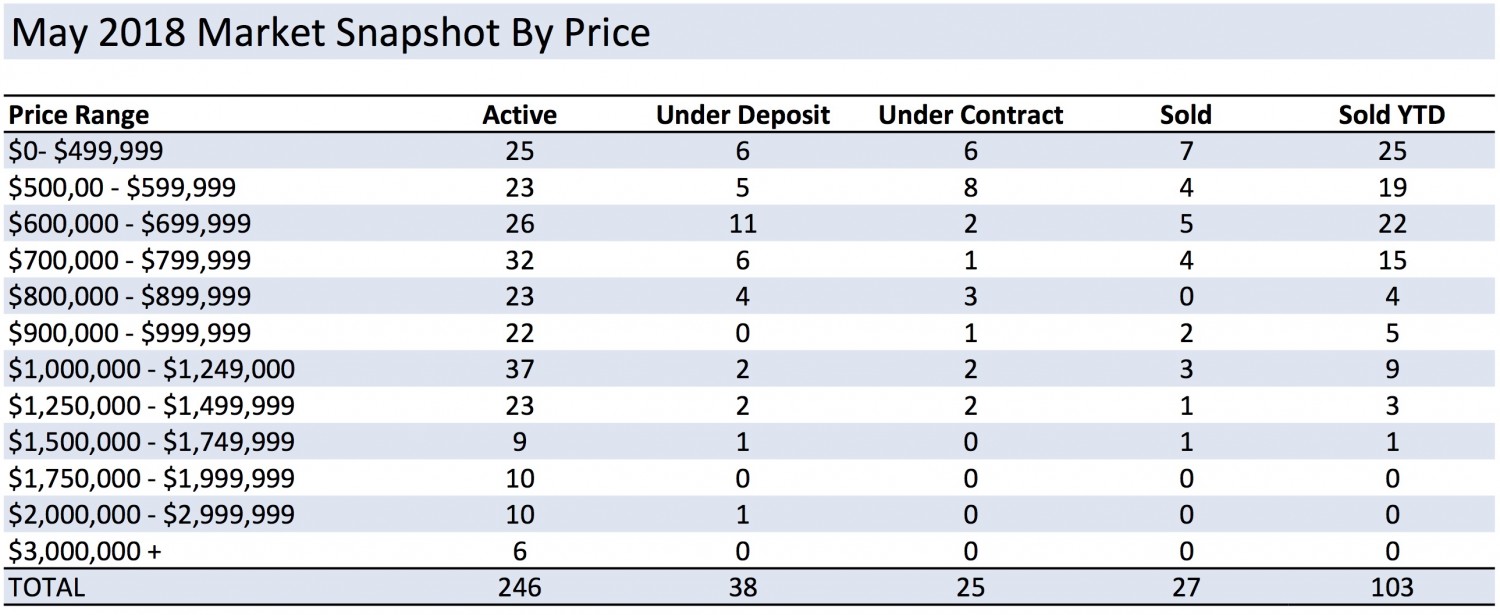
May 2018 was an interesting month. The number of closed sales was actually down with 27 sales as compared to 42 in May 2017. However, the median sales price was up almost 15%. Many more properties went under contract this year compared to the same time last year, and the days on market is lessened by almost 26%. Compared to last year, inventory is still low, as is the number of new properties entering the market.
To see an overview of how May looked, you can click for a snapshot of the market.
MEDIAN SALES PRICE and CLOSED SALES
The number of closed sales was down compared to the same time last year with only 27 properties selling in April 2018 as compared to 42 in 2017. In YTD sales we are down 18% vs 2017 with 103 properties selling as compared to 126. This is not completely unexpected as homes closing in May would generally take deposits in March. March 2018 was cold, snowy and stormy without much market activity, so it stands to reason that the number of homes closing is less than last year. The Median Sales Price rose to $651,000 compared with $565,000 in May 2017, while the YTD median sales price also rose by 3.5% over last year.
PROPERTIES UNDER CONTRACT
Continuing the positive news, the number of properties that opened escrow drastically increased over the same time last year with 76 properties going under deposit in May as compared to 51 last year. Similarly, in the year-to-date deposits, there are 178 as compared to 147 by this time last year.
DAYS ON MARKET and INVENTORY
The months of inventory has decreased to only 4.9 months compared with 8.6 months last year. Also slightly alarming is the decrease in new properties coming on the market — May 2018 posted 8.0% fewer properties than last year and the lack of inventory can be a concern for buyers as they look for their next residence. The average days on market has decreased by 26% over May 2017 with homes spending an average 118 days instead of 160 on the market before selling. Year to date, the average days on market time is sitting at 147 days, as compared to 193 days last year at this time.
Click here to see a price breakdown of the Ridgefield Real Estate Market.
Now is a good time prepare or list your home for sale. Feel free to contact me to discuss your needs, or for my complimentary Comparative Market Analysis to find out what your home’s worth in today’s market.
We continue to lead the market with the most comprehensive, proven marketing initiatives allowing your home to be in front of the widest audience possible on a local, regional, national and global level. We recognize your home is your biggest asset and both buyers and sellers experience an unparalleled level of customer service when working with us. Contact us today!
Ridgefield Market Report April 2018
April 2018 brings with it continued good news. Given the spring selling market was delayed by about 6 weeks due to inclement weather, we are now seeing properties taking deposits at a higher rate than normal. The number of new properties entering the market is about the same as last year, while the number of months of inventory is actually lessened somewhat indicating strong demand. Overall the number of properties up is higher than in April last year even though the YTD sales are slightly lower. The median value is also down slightly, however, as we push towards the summer, we hope to see those numbers rise as we catch up to the late spring start.
To see an overview of how April looked, you can click for a snapshot of the market
MEDIAN SALES PRICE and CLOSED SALES
The number of closed sales was up compared to the same time last year with only 28 properties selling in April 2018 as compared to 23 in 2017. In YTD sales we are down 11% vs 2017 with 75 properties selling as compared to 84. The Median Sales Price also slipped a little with April numbers posting 2.8% lower than last year, and the YTD sitting at $627,500 versus $629,500 in 2017.
PROPERTIES UNDER CONTRACT
The number of properties that opened escrow drastically increased over the same time last year with 67 properties going under deposit in April as compared to 35 last year. That marks an increase of 91%. Similarly, in the year-to-date deposits, there are 126 as compared to 96 by this time last year. We hope to see this trend continue.
DAYS ON MARKET and INVENTORY
We are still dealing with an extreme shortage of properties available for sale this month. The months of inventory has decreased to only 5.2 months compared with 11.5 months last year. Ninety-four new properties entered the market this month, compared with 99 in April of last year. The average days on market has decreased by 41% over April 2017 with homes spending an average of 125 days instead of 211 on the market before selling. Year to date, the average days on market time is sitting at 156 days, as compared to 210 days last year at this time.
Now is a good time prepare or list your home for sale. Feel free to contact me to discuss your needs, or for my complimentary Comparative Market Analysis to find out what your home’s worth in today’s market.
We continue to lead the market with the most comprehensive, proven marketing initiatives allowing your home to be in front of the widest audience possible on a local, regional, national and global level. We recognize your home is your biggest asset and both buyers and sellers experience an unparalleled level of customer service when working with us. Contact us today!
Q1 2018 Ridgefield Market Report
Single-family home sales were impacted by the weather more than usual in 2018, as compared to any other year in recent history. The unprecedented three back-to-back Nor’easters reeked havoc with buyers and further stalled a market already hampered by an unusually damp and dismal winter. Coupled with the uncertainty of the impact of the 2018 tax reform and we are seeing a very slow start to 2018.
Overall, we have seen 47 homes sell in the first quarter of 2018 compared to 61 in 2017. The median price showed an increase 3.5% up from $606,000 in 2017 to $627,500 in 2018. Total sales volume is also down registering at just under $31 million from almost $44 million at this time last year.
Market inventory is slightly decreased with an average of 209 properties for sale as compared to 265 last year. This may be due to the problems with the weather as sellers hold off for a more favorable time to list their homes for sale. However, for properties that do list, the average number of days a home is spending on the market has decreased from 209 in 2017 to 175 this year.
In condo news, the number of sales is up slightly from 12 sales in 2017 to 15 this year. Similarly, the median sales price increased from $217,000 to $230,000.
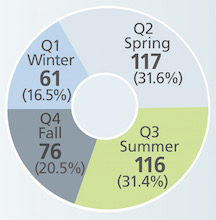
Looking forward to spring, there is encouraging news with 38 properties currently under agreement and 37 already in contract. We are also seeing an uptick in the number of listings entering the market on a daily basis, providing a much-needed influx of inventory. As seen below, typically most homes tend to close in Q2 and Q3, with deposits taken in Q1 and Q2. Due to the weather, there may be a shift this year to more homes closing in the summer rather than the later spring months.
Rising interest rates should also favorably impact our peak selling months of April, May and June as people jump into the market and maximize their buying power. In-town properties continue to experience the most foot traffic and showings. As a result a number of these sales have resulted in multiple offers, which is a positive sign for a strong second quarter.
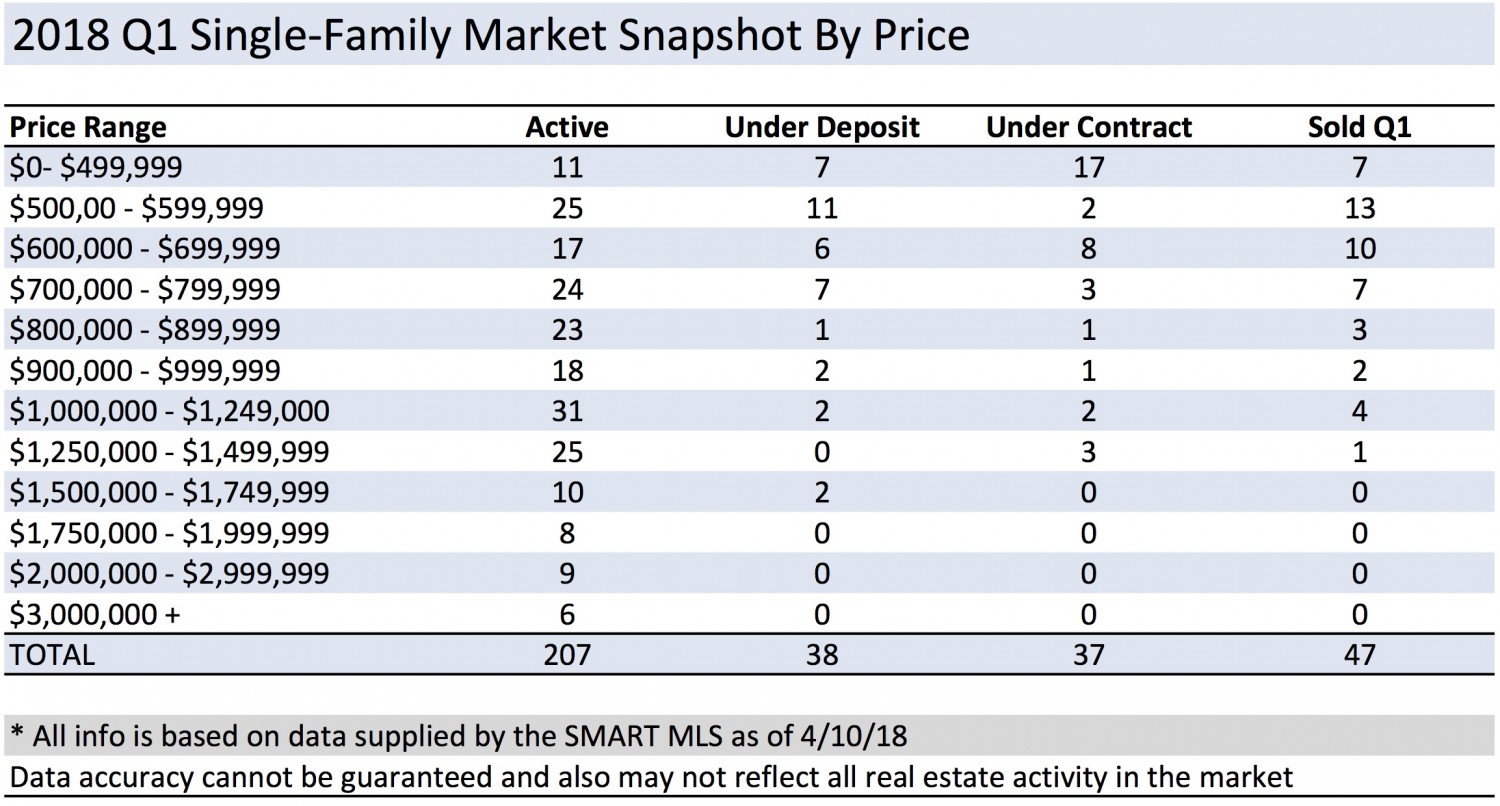
Below is a snapshot of the first quarter market broken down by price.
If you are thinking of listing you home for sale, now would be a good time to call us for a complimentary Market Analysis. Contact me for more information.

Compass CT
470 Main Street
Ridgefield CT 06877
203.856.5534
CompassCTBOR@compass.com
Licensed in the state of Connecticut & New York.