Ridgefield Market Report January 2017

2017 has started out with a bang. Median sales price, number of homes sold and number of new homes listed for sale have all increased. The warm weather throughout the winter months seems to have boosted sales, and we hope to see the increased market movement continue. Consumer confidence appears to be increasing, and as mortgage rates threaten to rise slightly, more buyers are taking advantage of available inventory.

MEDIAN SALES PRICE and CLOSED SALES
The number of closed sales was up 33% compared to January 2016 with 20 homes sold compared to 15 at the same time last year. The median sales price was also up from $590,000 to $650,000 in 2017 – an increase of 10.2% – which is great news for sellers. We have even seen updated, well-priced homes receive multiple offers.

PROPERTIES UNDER CONTRACT
The number of properties that went under contract also increased over last year with 35 homes entering escrow compared to only 14 in January 2016. This represents an increase of 150% over last year. The number of new properties listed for sale also increased 19% from 42 to 50 during the same time this year.

DAYS ON MARKET and INVENTORY
The number of days on market increased from 112 in January, 2017 to 190 this year. However, the months supply of inventory is only 7.8 months compared to 21.8 months at this time last year. We are hoping to see more inventory come on the market in the upcoming few months.

See a full graphical analysis of Ridgefield’s January 2017 real estate market report, and take advantage of my complimentary Comparative Market Analysis to find out what your home’s worth.

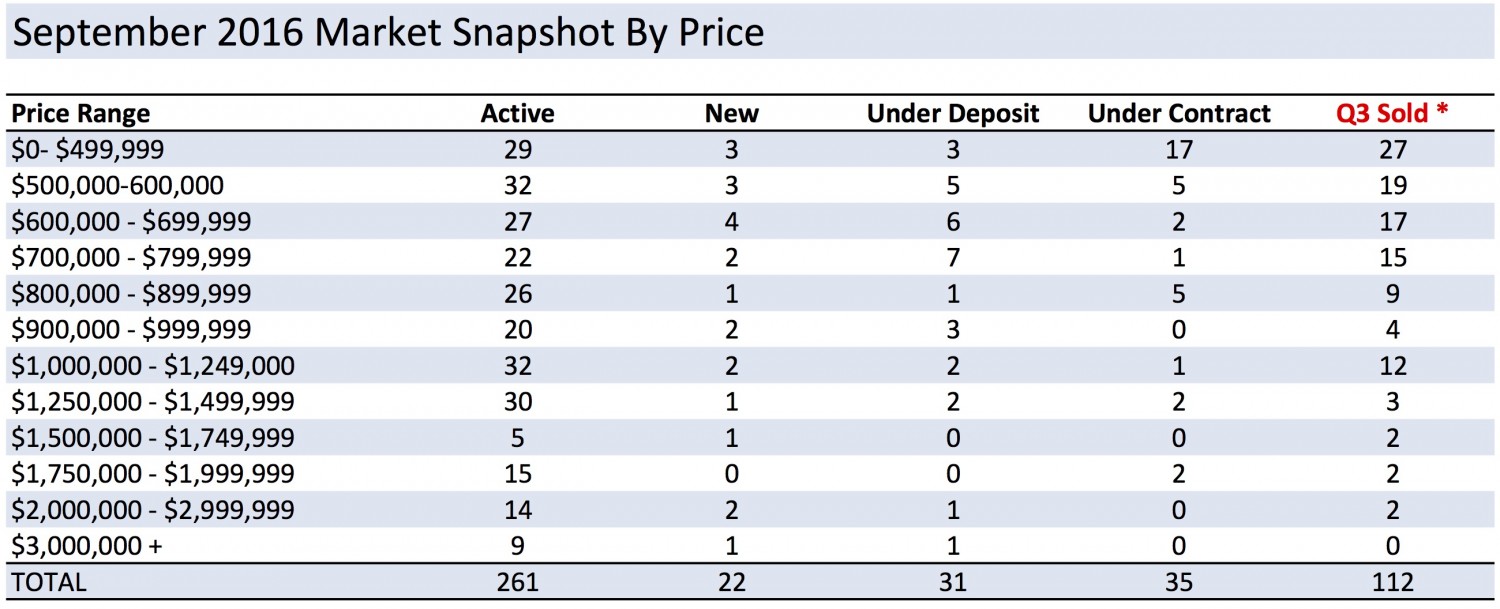
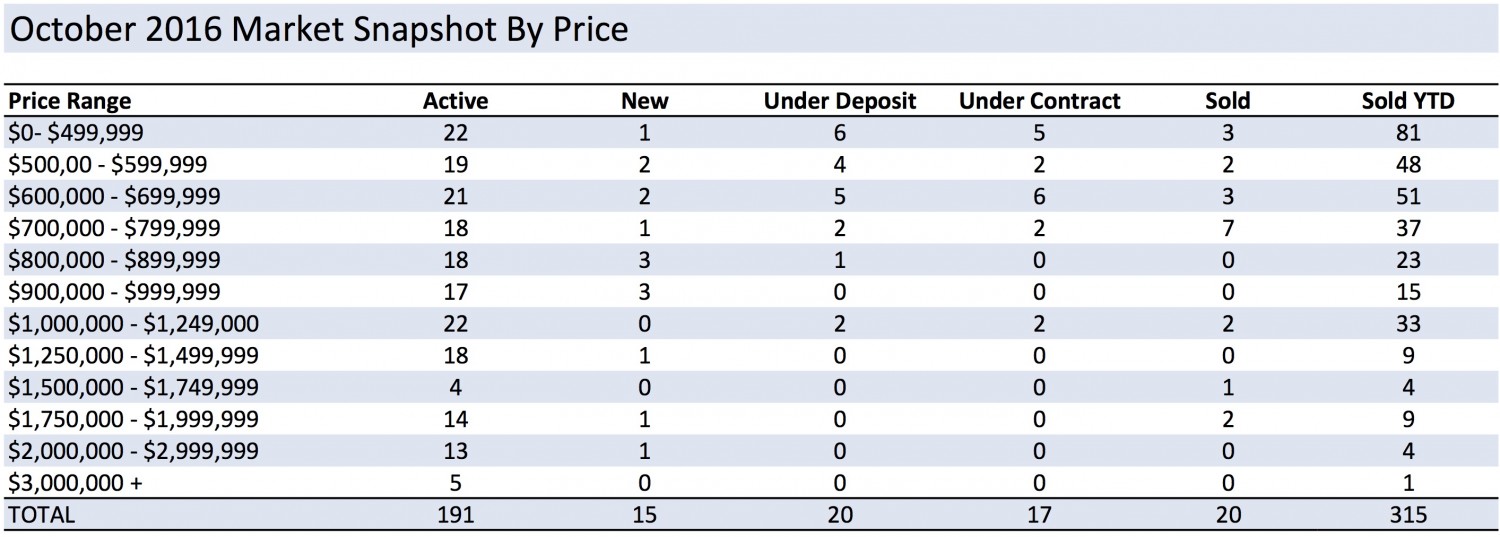
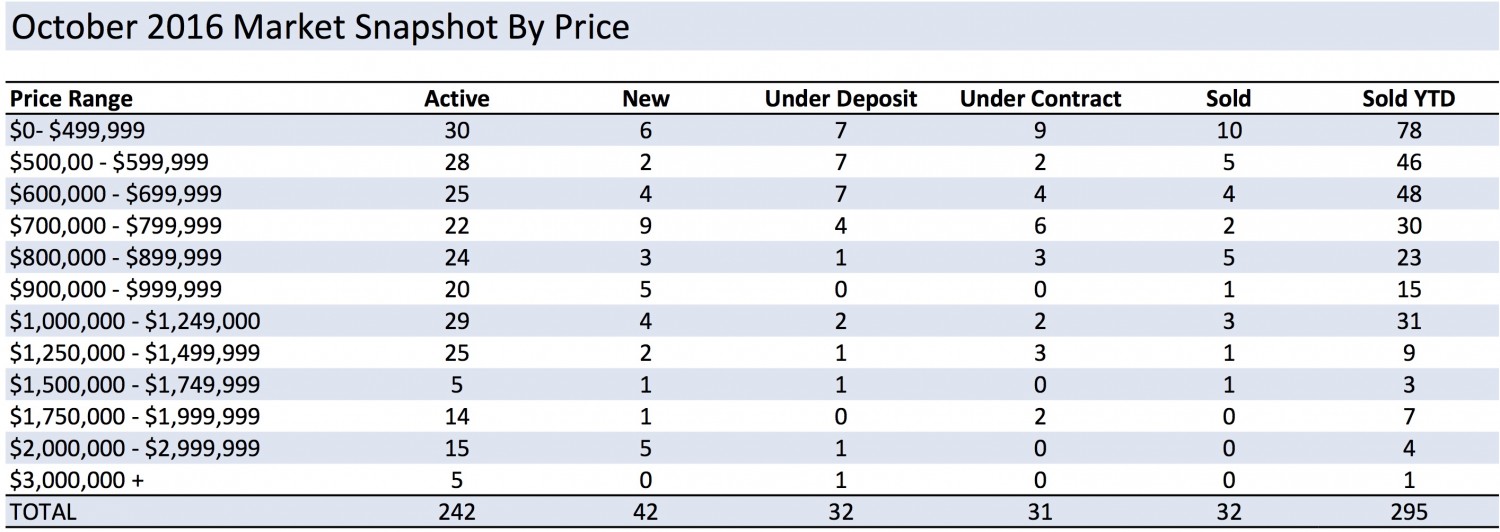
For a breakdown of the Ridgefield Real Estate Market by price, view the January 2016 price snapshot.

* All data taken from Greater Fairfield County CMLS as of 02/01/2017

Ridgefield’s 2016 Year End Market Report

What a year! The Ridgefield Real Estate market rallied resulting in the best year since 2013’s banner season. Overall sales volume was up at $259,407,724 as compared to $241,208,027 in 2015. Unit sales increased 8.1% with 348 homes selling in 2016 compared to 322 the year before. With the uncertainty of an election year behind us, as well as steady increases seen in financial markets and slowly rising interest rates, there is reason to believe that this trend towards slow and steady growth in the Ridgefield Real Estate market will continue.

A Buyer’s Market
Buyers were out in force in 2016, and they had a lot to choose from. Armed with a plethora of information at their fingertips, historically low interest rates and a 12.5% increase in Ridgefield home inventory over 2015, they were able to make better, more informed decisions than ever before. The fourth quarter of 2016 was unusually busy and set up a strong pipeline into the first quarter of 2017. This is reminiscent of what happened at the end of 2012 and into 2013. Predictors suggest continued growth and improving sales throughout 2017.

No Bump In Price
The median sales price for a Ridgefield home remained relatively the same in 2016, decreasing
by only 1.9% to $640,000 from last year’s 2015 $652,500. The average sales price was $745,424
compared to $749,093 in 2015, while the sale to list price ratio was 96.4%. The rise of the “HGTV -phenomenon” placed a burden on sellers with buyers expecting homes to have kitchen and
bathroom upgrades, as well as more current design elements. We see this trend continuing.

Looking Ahead
While there has been no appreciable increase in home values, the market indicators continue to point to a stable real estate market. With inventory increasing, and interest rates slowly climbing, buyers will continue to look to invest in homes they feel offer real value. As always, location plays a key role in purchasing decisions with homes residing in-town or in good commute locations creating the greatest demand. As baby boomers become empty nesters, all indicators point to a demand for more functional homes that can be easily maintained. At the same time, we have seen upward movement in the market from Ridgefield residents moving their families into more spacious homes, as well as from buyers moving into Ridgefield to take advantage of our highly-ranked schools and great community.

DOWNLOAD THE REPORT HERE

Happy Holidays To All

During the Holiday Season, our thoughts turn gratefully to those who have made our progress possible. It is in that spirit that we say thank you. Best wishes for a happy and healthy new year from all of us at Karla Murtaugh Homes.

Ridgefield Market Report November 2016

November 2016 proved to be a strong month for home sales. The median price of a home increased substantially over last year , however we still trail 2015’s year-to-date median sale price by almost 2%. Overall, 2016 has seen more homes sell than 2015, and we hope to close out the year with a strong December.

MEDIAN SALES PRICE and CLOSED SALES
The number of closed sales was down 19.2% at 21 compared to 26 last year, but we are up 8.5% overall in the year-to-date with 320 properties sold compared to 295 by the same time in 2015. There was an increase in median sold price for this month from $640,000 to $732,500 representing an 14.5% increase compared to November 2015. We are still slightly down from last year’s year-to-date with the median price standing at $647,500 compared with $660,000 by this time last year.

PROPERTIES UNDER CONTRACT
We continue to see a strong fall selling season with 45 properties going under contract in November, compared to only 23 during the same time last year – an increase of 95.7%. Overall, the fall market is up 18.5% compared to the same time in 2015 with 358 properties in escrow compared to 302 last year.

DAYS ON MARKET and INVENTORY
The number of days on market increased from 155 in November, 2015 to 194 this year. However, months supply of inventory is only 7.3 months compared to 17.2 months at this time last year.

See a full graphical analysis of Ridgefield’s November 2016 real estate market report, and take advantage of my complimentary Comparative Market Analysis to find out what your home’s worth.

For a breakdown of the Ridgefield Real Estate Market by price, view the November 2016 price snapshot.

* All data taken from Greater Fairfield County CMLS as of 12/01/2016

Are You A Bad Mom?

On Wednesday, November 2nd, 30 wonderful moms joined us at the Prospector Theatre for a client appreciation night. Featuring a fabulous Bad Moms Signature Cocktail, the Prospector Star Bar welcomed us with open arms and a wonderful night of camaraderie was had by all.

Having been a supporter of the Prospector since it’s inception – and the inspiring work of Sphere before that – I am always amazed by the drive and ingenuity of fearless leader Val Jensen. The opportunities the Propsector offers to adults with disabilities serves as a role model for what can be done regionally, nationally and internationally to improve the lives of so many people.

A seriously funny movie, we found ourselves relating to the “Bad Mom” in all of us as we laughed out loud and shared in the challenges of our busy lives.

Thanks, Bad Moms, for joining us and celebrating all we do!

img_3899

img_3890

img_3898

Ridgefield Market Report October 2016

Fall 2016 has started off with strong sales in the month of October. Year-to-date the total number of closed sales has surpassed last year, but median sales price is slightly down.

MEDIAN SALES PRICE and CLOSED SALES
The number of closed sales was up 18.5% at 32 compared to 27 last year, and we are up 10.8% overall in the year-to-date with 298 properties sold compared to 269 by the same time in 2015. There was a decrease in median sold price for this month from $672,500 to $617,000 representing an 8.3% decrease compared to October 2015. We are also slightly down from last year’s year-to-date with the median price standing at $643,150 compared with $665,000 by this time last year.

PROPERTIES UNDER CONTRACT
We are seeing a strong fall selling season with 54 properties going under contract in October, compared to only 28 during the same time last year – an increase of 92.9%. Overall, the fall market is up 21.1% compared to the same time in 2015 with 338 properties in escrow compared to 279 last year.

DAYS ON MARKET and INVENTORY
The number of days on market increased from 158 in October, 2015 to 202 this year. However, months supply of inventory is only 7.2 months compared to 15.3 months at this time last year.

See a full graphical analysis of Ridgefield’s October 2016 real estate market report, and take advantage of my complimentary Comparative Market Analysis to find out what your home’s worth.

For a breakdown of the Ridgefield Real Estate Market by price, view the October 2016 price snapshot.

* All data taken from Greater Fairfield County CMLS as of 06/01/2016

More Bathrooms? Yes Please!

Here’s a little something fun to think about … apparently, Americans want more bathrooms at home!

According to Realtor.com, the share of new homes started with three or more full bathrooms is on the rise. That also reflects builders’ focus on the higher-end, larger homes since the end of the Great Recession.

Twenty-seven percent of new single-family homes started in 2015 had three full bathrooms and 10 percent had four or more, Census Bureau data shows. Fifty-nine percent of homes had two full bathrooms and just 4 percent had one – or less.

The South Atlantic region of the U.S. has the largest share of new homes with three or more bathrooms at 42 percent. Other regions with the highest shares of three or more bathrooms in new-home starts included the Mountain region at 39 percent, Pacific region at 38 percent, and West South Central divisions at 38 percent. New England is right in the middle at 30%, while the East North Central division had the lowest share of new homes with three or more bathrooms at 24 percent.

The following chart shows the regional breakdown of the percentage of new homes with three or more full bathrooms.


Source: “Bathrooms in 2015 New Homes,” National Association of Home Builders’ Eye on Housing blog (Oct. 6, 2016)

Ridgefield Q3 2016 Market Report

July through September 2016 showed strong sales figures on track with the sales we saw in 2015. 112 single-family homes sold in Ridgefield in Q3 this year, compared to 103 during the same time in 2015. The median sales price dropped 7% from $688,000 in Q3 2015 to $640,000 this year, but homes are still selling at 96.7% of asking. The average time a house spent on the market was 148 days during this quarter. In the luxury segment of homes priced over $1.5 million, there continues to be a slow but steady demand. Condo sales were strong with 22 selling during Q3 at a median price of $286,000. There are currently 39 condos on the market with an average market time of 154 days. Tracking sales compared to mid-year, the number of homes sold is up, but values remain flat or declining at certain price points. As we move into the final quarter for 2016, October has seen more market movement and we hope to see a strong fall market. Buyers continue to demand updated, pride-of-ownership homes and pricing seems to be the key in creating a successful sale.
q3-2016-price-snapshot-sheet1

Buyers Pay More For Houses In A Great School District

Building on last week’s blog discussing Ridgefield High School’s phenomenal school ranking, it pays to buy a house in a sought-after and highly ranked school district. According to a recent study just published on Realtor.com, in most markets, families are willing to pay more for a highly ranked school than an extra bedroom, a shorter commute, and even big home features such as a swimming pool, higher ceilings, sport courts, and even a private dock.

Realtor.com overlaid data from their residential listings database with granular school ratings from GreatSchools.org. Specifically, they aggregated key price, demand and supply metrics for all homes listed during the first half of 2016, and compared properties located in school districts rated nine or 10 on the GreatSchools.org 10-point scale against all other homes, as well as homes in lower rated districts.

The analysis shows homes within the boundaries of the higher rated public school districts are, on average, 49 percent more expensive – at $400,000 – than the national median list price of $269,000 and 77 percent more expensive than schools located within the boundaries of lower ranked districts with a median of $225,000. Houses located in these areas, on average, also move eight days faster than homes in below average school districts and sell four days faster – at 58 days – than the national median of 62 days.

For many years now, Ridgefield Public School District, as well as the individual schools, have ranked well in numerous reports issued annually.  Last week we reported on Ridgefield High School superior ranking in Newsweek’s annual America’s Top High Schools list for 2016.  Most recently, the 2016 Best School Districts by Niche.com ranked Ridgefield School District number eight in Connecticut and 58th Nationally. The Niche.com ranking provides a comprehensive assessment of the overall experience of a school district and takes into account key factors such as the strength of academics, quality of teachers, school resources, the quality of student life, as well as student and parent reviews, in an attempt to measure the overall excellence of the district.  The final ranking results in 10,488 districts receiving a numerical ranking.