Q1 2018 Ridgefield Market Report

Single-family home sales were impacted by the weather more than usual in 2018, as compared to any other year in recent history. The unprecedented three back-to-back Nor’easters reeked havoc with buyers and further stalled a market already hampered by an unusually damp and dismal winter. Coupled with the uncertainty of the impact of the 2018 tax reform and we are seeing a very slow start to 2018.

Overall, we have seen 47 homes sell in the first quarter of 2018 compared to 61 in 2017. The median price showed an increase 3.5% up from $606,000 in 2017 to $627,500 in 2018. Total sales volume is also down registering at just under $31 million from almost $44 million at this time last year.

Market inventory is slightly decreased with an average of 209 properties for sale as compared to 265 last year. This may be due to the problems with the weather as sellers hold off for a more favorable time to list their homes for sale. However, for properties that do list, the average number of days a home is spending on the market has decreased from 209 in 2017 to 175 this year.

In condo news, the number of sales is up slightly from 12 sales in 2017 to 15 this year. Similarly, the median sales price increased from $217,000 to $230,000.

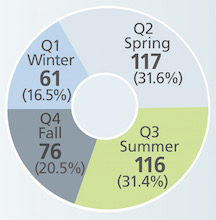
Looking forward to spring, there is encouraging news with 38 properties currently under agreement and 37 already in contract. We are also seeing an uptick in the number of listings entering the market on a daily basis, providing a much-needed influx of inventory. As seen below, typically most homes tend to close in Q2 and Q3, with deposits taken in Q1 and Q2. Due to the weather, there may be a shift this year to more homes closing in the summer rather than the later spring months.

Rising interest rates should also favorably impact our peak selling months of April, May and June as people jump into the market and maximize their buying power. In-town properties continue to experience the most foot traffic and showings. As a result a number of these sales have resulted in multiple offers, which is a positive sign for a strong second quarter.

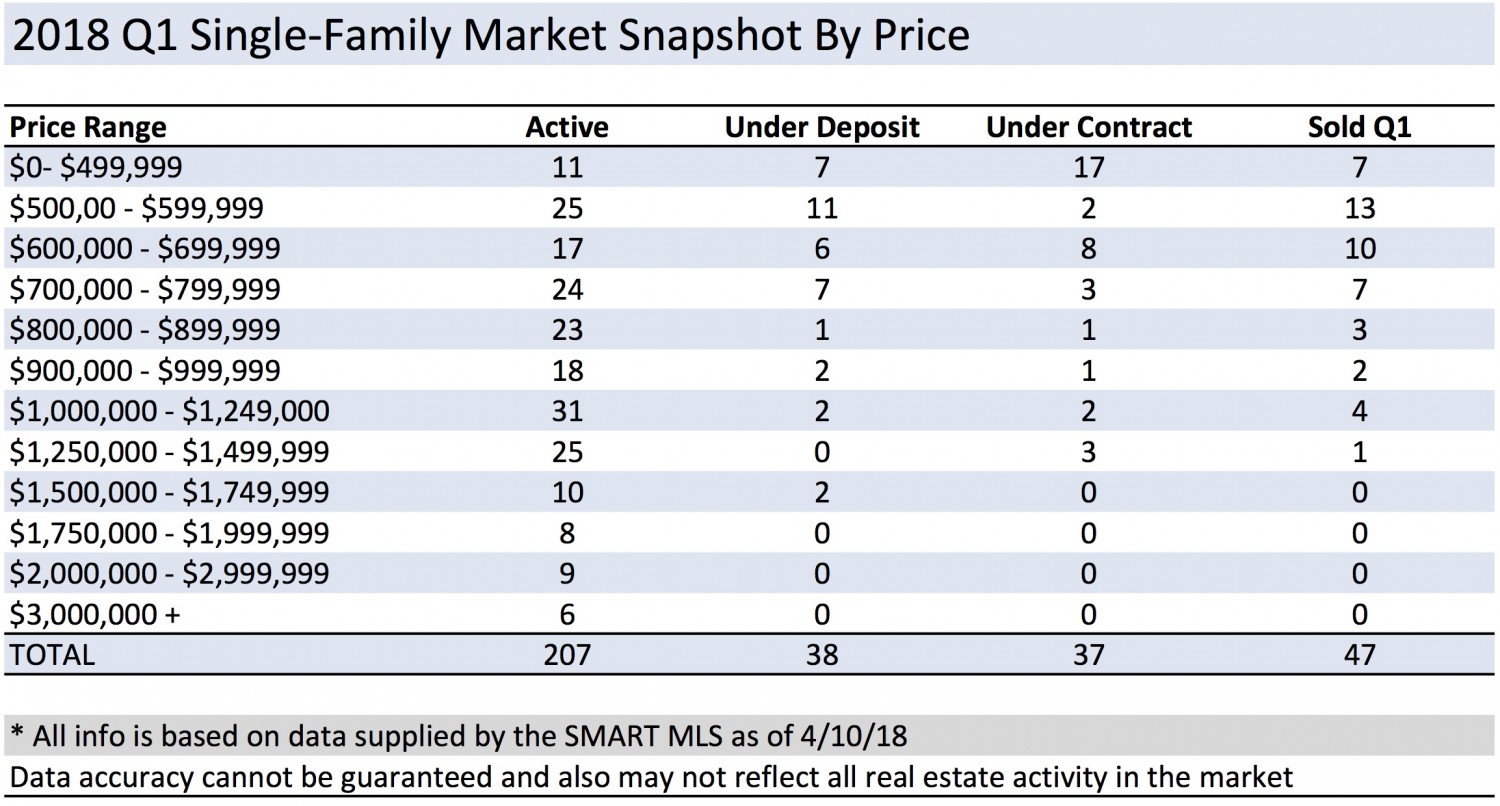
Below is a snapshot of the first quarter market broken down by price.

If you are thinking of listing you home for sale, now would be a good time to call us for a complimentary Market Analysis. Contact me for more information.

Ridgefield Market Report March 2018

March 2018 continues to see many more properties taking deposits and going under contract, which is a good indicator of a strong spring and summer real estate market. We continue to see drastically low inventory levels, but that may be attributed to sellers’ hesitancy to list while we wait for the late season snow to dissipate. Overall, the number of year-to-date sales are lower than at the same time last year, however the median price of homes in Ridgefield has increased year-over-year.

To see an overview of how March looked, you can click for a snapshot of the market, or a breakdown by price.

MEDIAN SALES PRICE and CLOSED SALES
The number of closed sales was down compared to the same time last year with only 11 properties selling in March 2018 as compared to 18 in 2017. This represents a decrease of 39%. In YTD sales we are down 25% vs 2017. The Median Sales Price however, increased by 4% over the same time last year to $631,375.

PROPERTIES UNDER CONTRACT
The number of properties that opened escrow drastically increased over the same time last year with 62 properties going under deposit in March as compared to 24 last year. That marks an increase of 102%. Similarly, in the year-to-date deposits, there are 102 as compared to 61 by this time last year. we hope to see this trend continue as the weather warms up.

DAYS ON MARKET and INVENTORY
We are still dealing with an extreme shortage of properties available for sale this month.  The months of inventory has decreased to only 4.5 months compared with 14.1 months last year. Sixty-eight new properties entered the market this month, compared with 72 in March of last year. The average days on market has decreased by 14% over March 2017 with homes spending an average of 191 days instead of 223 on the market before selling. Year to date, the average days on market time is sitting at 175 days, as compared to 209 days last year at this time.

Now is a good time prepare or list your home for sale. Feel free to contact me to discuss your needs, or for my complimentary Comparative Market Analysis to find out what your home’s worth in today’s market.

We continue to lead the market with the most comprehensive, proven marketing initiatives allowing your home to be in front of the widest audience possible on a local, regional, national and global level. We recognize your home is your biggest asset and both buyers and sellers experience an unparalleled level of customer service when working with us. Contact us today!

Snapshot of March Market Report

.